When I was trying to generate an image containing scatter-plot and a barchart with error bars, I got stuck with barchart part. There were no demos or samples that produces the desired output. So, I ended up figuring it out myself.
Below is the gnuplot code, data sample and the output.
set term png size 500,400
set output "boxerror-test.png"
set boxwidth 0.5
set style fill transparent solid 0.5 noborder
set yrange [0:100]
set xrange [0:5]
plot "boxerror-test.data" using 1:2:3:xticlabels(4) w boxerror lc rgb "#444444" lw 1.5 title "BoxerrorTest"
Sample data:
1	25	3	A
2	33	5	B
3	50	2	C
4	12	0.5	D
And the final output:
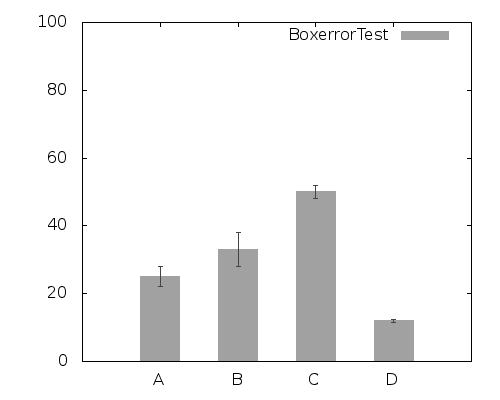
Ideally, I was trying to plot the following data:
A       25      3
B       33      5
C       50      2
D       12      0.5
But I wasn’t able to use first column directly as data. So, first column is actually numbers and fourth column provides the xticlabels.
If your gnuplot version is less than 4.4, transparency won’t work, in that case remove “transparent” from set style line.