In this post, I’ll demonstrate how to use gnuplot in a one-liner. We’ll use the pipe but unfortunately you cannot pipe raw data to gnuplot directly (as far as I know). The piped data should contain basic gnuplot commands on top. So, we’ll use the following template:
very-complicated-data-generating-commands | sed -e "1i\plot '-' " | gnuplot -persist
If you’re interested in quickly see how this works, try something simple:
seq 1 10 | sed -e "1i\plot '-'" | gnuplot -persist
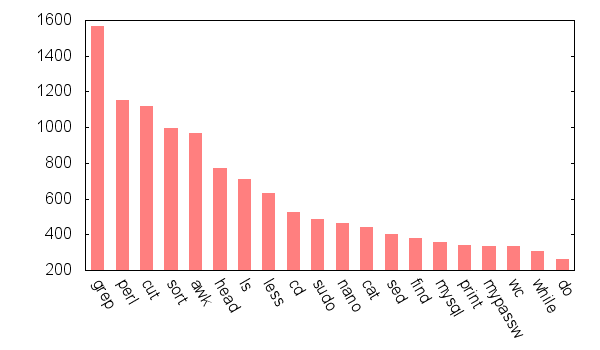
Before sed command, you can write as complicated as possible command to generate data and inside sed command you can put long gnuplot commands to obtain graphs. Let’s see the counts of most used 20 commands from history (mentioned in an earlier post with bar chart.
cat ~/.bash_history|grep -v "^#" | perl -F"\||<\(|;|\`|\\$\(" -alne 'foreach (@F) { print $1 if /^.*?(\w+)\b/i }' | sort | uniq -c | sort -nr | head -20 | awk '{print $2"\t"$1}' | sed -e "1i\set boxwidth 0.5\nset style fill solid noborder\nset xtics nomirror rotate by -60\nset format x '-%s'\nplot '-' using 2:xticlabels(1) with boxes notitle" | gnuplot -persist
Resulting image looks like this:
If you want to save the output in png format, what you do is simply add the command set term png size 600,300 to your one-liner. I chose width 600px and height 300px as example. In this case, gnuplot prints the contents of png file to screen, so we need to direct it to a filename, as shown below:
cat ~/.bash_history|grep -v "^#" | perl -F"\||<\(|;|\`|\\$\(" -alne 'foreach (@F) { print $1 if /^.*?(\w+)\b/i }' | sort | uniq -c | sort -nr | head -20 | awk '{print $2"\t"$1}' | sed -e "1i\set term png size 600,350\nset boxwidth 0.5\nset style fill solid noborder\nset xtics nomirror rotate by -60\nset format x '-%s'\nplot '-' using 2:xticlabels(1) with boxes notitle" | gnuplot > sample_image.png